
Visualizing Uncertainty is an interface created to visualize the results of the research study conducted by Aaron Hill, Director of the Data Visualization program at Parsons School of Design in New York, NY. This paper was accepted into the IEEE Vis 2018 Conference in Berlin and seeks to organize contemporary artworks by Bertin's visual variables to draw principles to inspire ways to communicate uncertainty in data visualization.
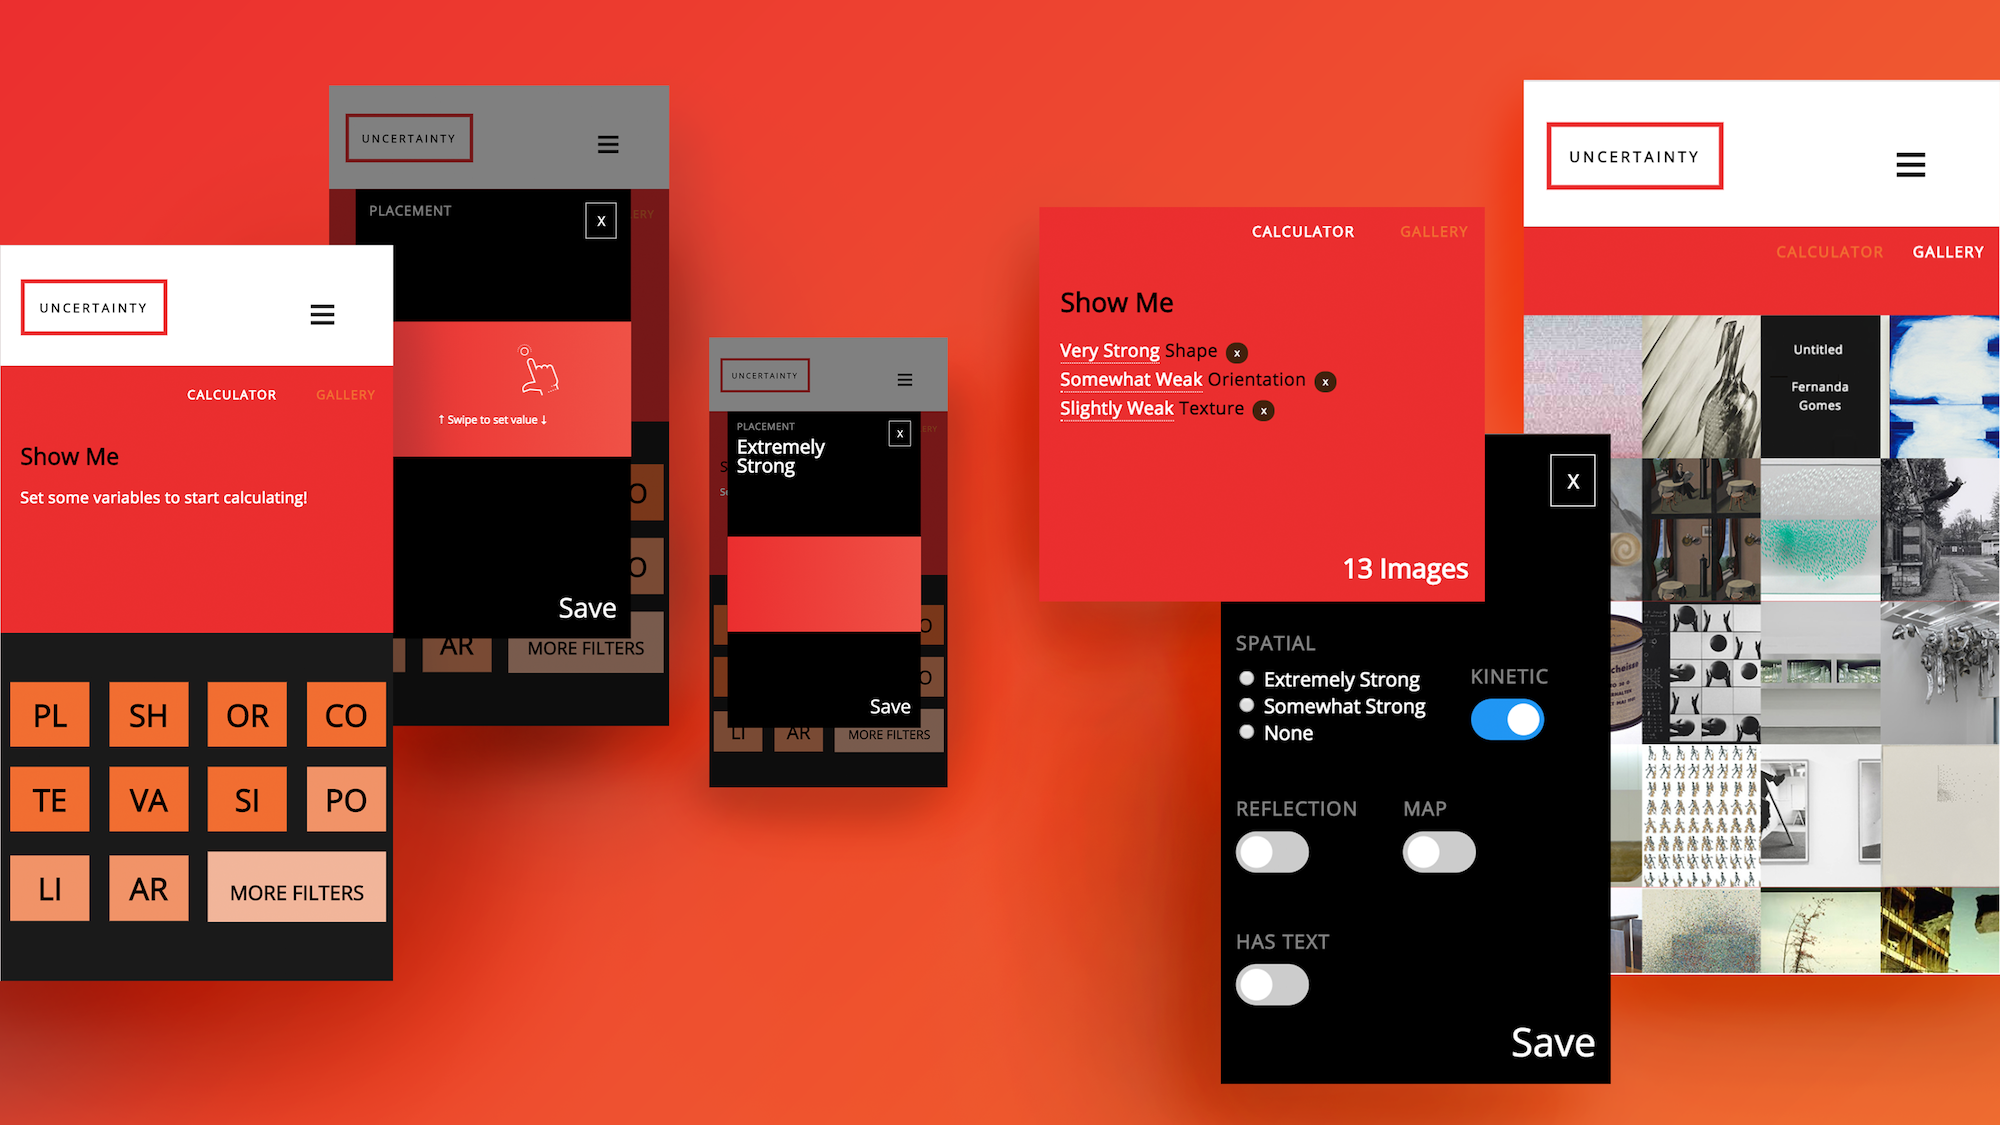
A calculator interface was pursued to both empathize and play on the irony of measuring visual attributes potentially arbitrary to convey uncertainty. First, visual variables were organized by hierarchy (primary, secondary, and tertiary). Then, the physical artifacts that manifested the variable types (continuous, ordinal, boolean) were designed for.
The final interface was created using javascript and d3.js as a web app. It behaves as a calculator, but invites participants to engage in a new way. For example, by instructing them how to use sliders to calculate primary visual variables and toggles for tertiary boolean variables. By "calculating" visual variables and viewing the different artworks that appear as a result, we hope that individuals are able to better understand what this research paper measured and the knowledge that it generated.
Data Source
 Tools
Team
This interface was designed and built for the research paper "Seeking New Ways to Visually Represent Uncertainty in Data: What We Can Learn from the Fine Arts", to be published in the IEEE Vis 2018 Conference in Berlin, Germany. Researchers who conducted the research and wrote the paper are referenced below.
Aaron Hill, Parsons School of Design
Clare Churchhouse, PhD, Parsons School of Design
Michael Schober, New School for Social Research
Tools
Team
This interface was designed and built for the research paper "Seeking New Ways to Visually Represent Uncertainty in Data: What We Can Learn from the Fine Arts", to be published in the IEEE Vis 2018 Conference in Berlin, Germany. Researchers who conducted the research and wrote the paper are referenced below.
Aaron Hill, Parsons School of Design
Clare Churchhouse, PhD, Parsons School of Design
Michael Schober, New School for Social Research


