00
Project Objective
Forms of Attraction clusters images from the MET's Costume Institute into items sharing similar form. This was done through machine learning to uncover new relationships between items beyond available metadata.
01
Batch Image Extraction
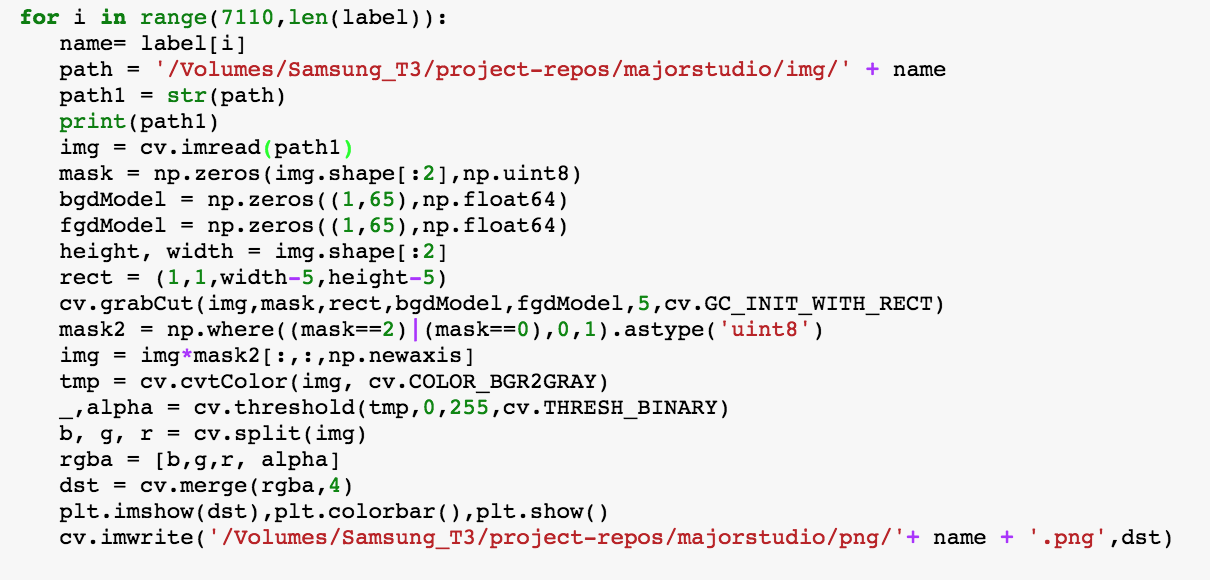
Costume Institute images were identified and downloaded from the MET API. Then, using opencv, an open computer vision library, all 7.6k costume images were extracted from their background to remove noise and information that can otherwise distract from the subject of the image.
02
Edge Detection
To "focus" only on form, I extracted the edge outlines of each image. The method used simply employs sobel edge detection to draw outlines around a black and white version of the image. It then blurs and accentuates detected edges and downscales the image.
03
Pixel Representation
To prepare features for machine learning, each image after transformation is processed as a 15x35 pixel-by-pixel list representation of the image. This is done to reduce the form into information the machine can easily read and draw comparisons and therefore patterns from: a clear list of numbers.
04
KMeans Model
K-means was selected as the model to cluster images based on similarity of shapes. The model was trained on creating 56 clusters from the dataset. Displayed are 3 examples from three different clusters from the model.
05
Data Structure
After joining the feature representations to the original MET dataset containing metadata for all 7.6k items, a flat json was generated.The flat json was converted into a hierarchical parent-child json for data visualization in d3. Each item is grouped a child of their parent cluster. Metadata preserved for display purposed includes: the title, link, src path, year, medium and culture for each item.
06
Results: Model Clusters
Model Clusters are grouping that performed best against my subjective visual criteria: similarity in outline form. These highlighted findings reveal strong patterns that carry a certain weight. In other words, I considered them as characteristic "forms of attraction".
07
Results: Evolution Across the Ages
This is perhaps the most exciting finding from this exploratory machine learning analysis of costumes by form in the MET. When filtering the final cluster analysis by century, one can unmistakeably with the naked eye see how certain forms began to carry a certain type of gravity. During the industrial revolution, when textile manufacturing became mechanized instead of handmade, we see a clear demarcation between the era of sparse unique forms and an era where the visual vocabulary finds standard and organization.
Data Source
 Tools
Special Thanks
Great appreciation goes out to those who provided instrumental feedback and guidance as well as generous provision of data sources that are the foundation of this project.
Aaron Hill
Director of Parson's MS Data Visualization, Machine Learning Professor
Richard The
Design + Technology Professor at Parsons
Jenni Choi
General Information Manager at the MET
Loic Tallon
Chief Digital Officer at the MET
Project Archive
Github Repo


